1. LOOKUP(expression, [offset])
This returns the value of the expression in a target row, specified as a relative offset from the current row.
For example, we have a table showing the number of employees hired each year.
Let’s find the difference in the number of employees hired in 2011 from the previous year (difference from previous row).
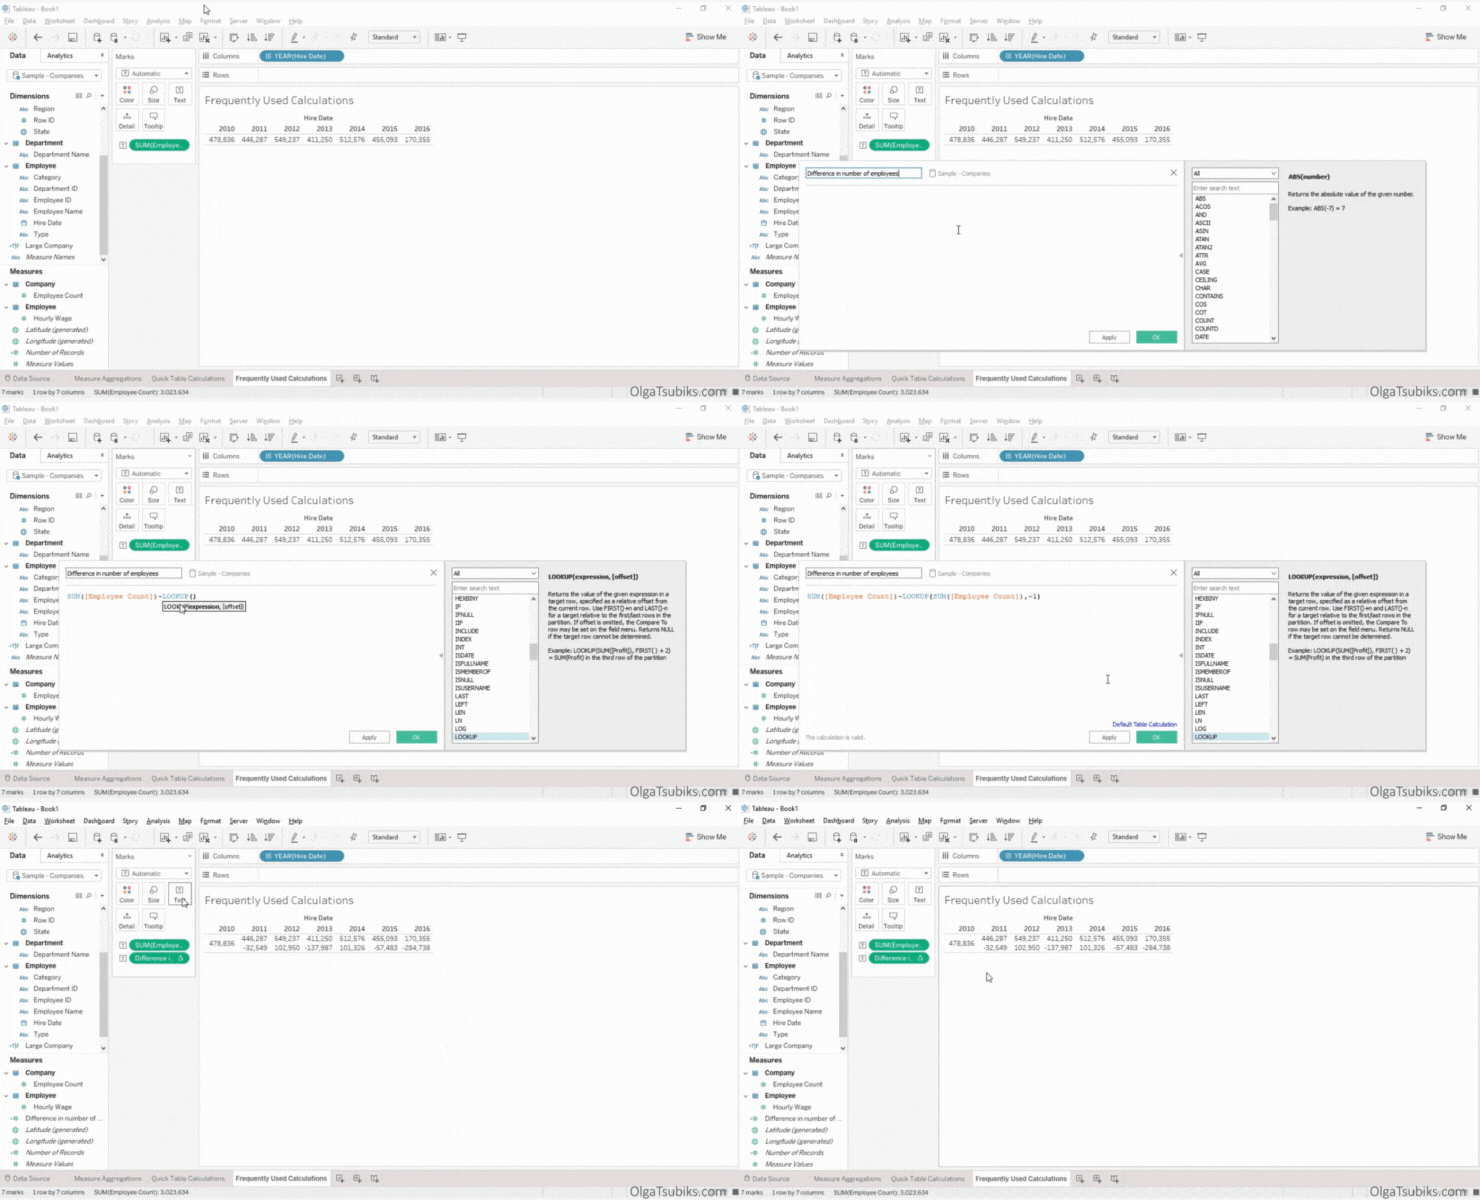
Solution: Create a new calculation called Difference in number of employees:
SUM([Employee Count])-LOOKUP(SUM([Employee Count]),-1)
The first part of the calculation gets the data for the current row.
The second part of the calculation looks at one row before the current row (-1).
Finally, it subtracts the current row from the previous row, to get the difference.
In 2011 fewer employees were hired (-32549).
Download/view this practice workbook
2. ZN()
This returns the expression if it is not null; otherwise it returns zero. Use this function when using zero values instead of null values.
For example, in the previous calculation, SUM([Employee Count])-LOOKUP(SUM([Employee Count]),-1), what would happen if we didn’t have data for one of the years? It would not calculate the difference, and return null. In some cases, it is better to replace nulls with 0.
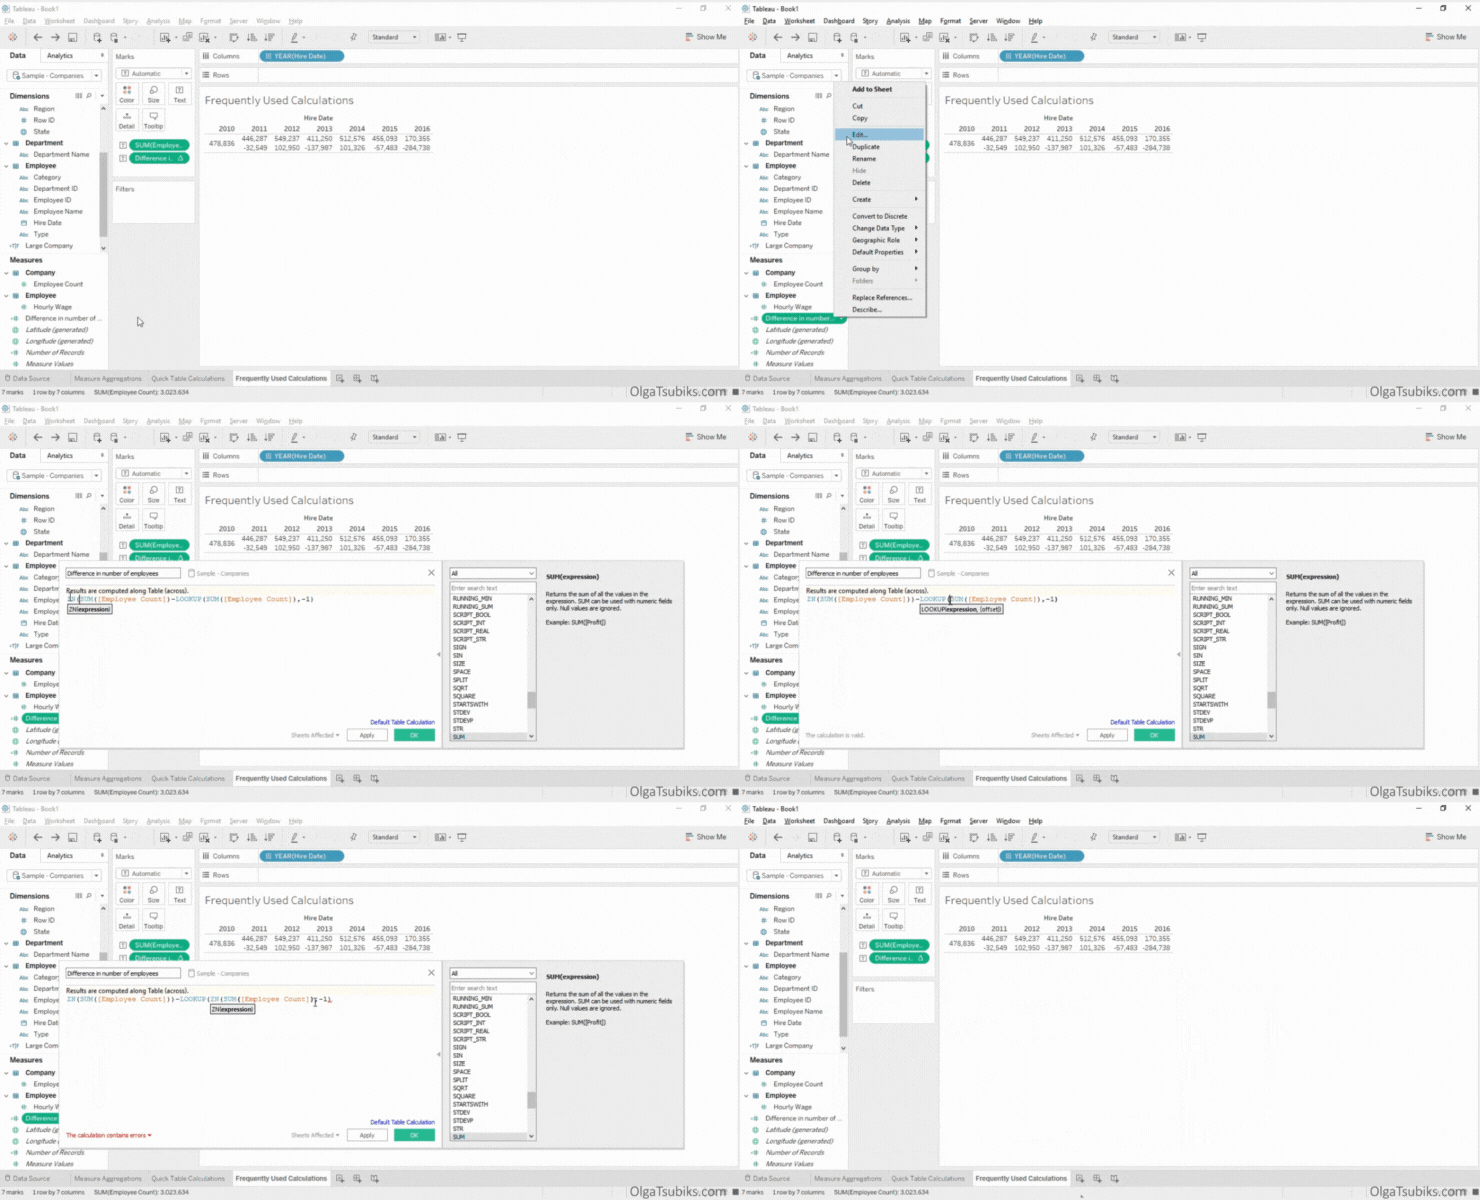
Solution:
Right-click on the calculation and select Edit. Add ZN() to each expression that might return as null:
ZN(SUM([Employee Count]))-LOOKUP(ZN(SUM([Employee Count])),-1)
You can find this calculation in Quick Table Calculations > Difference. Now you know exactly how it works!
3. TOTAL()
This returns the total for the given expression in a table calculation partition. Use this calculation for totals.
For example, take a look at the table of the number of employees hired each year. Let’s add a total row and use it to calculate the percentage of total employees hired in each year.
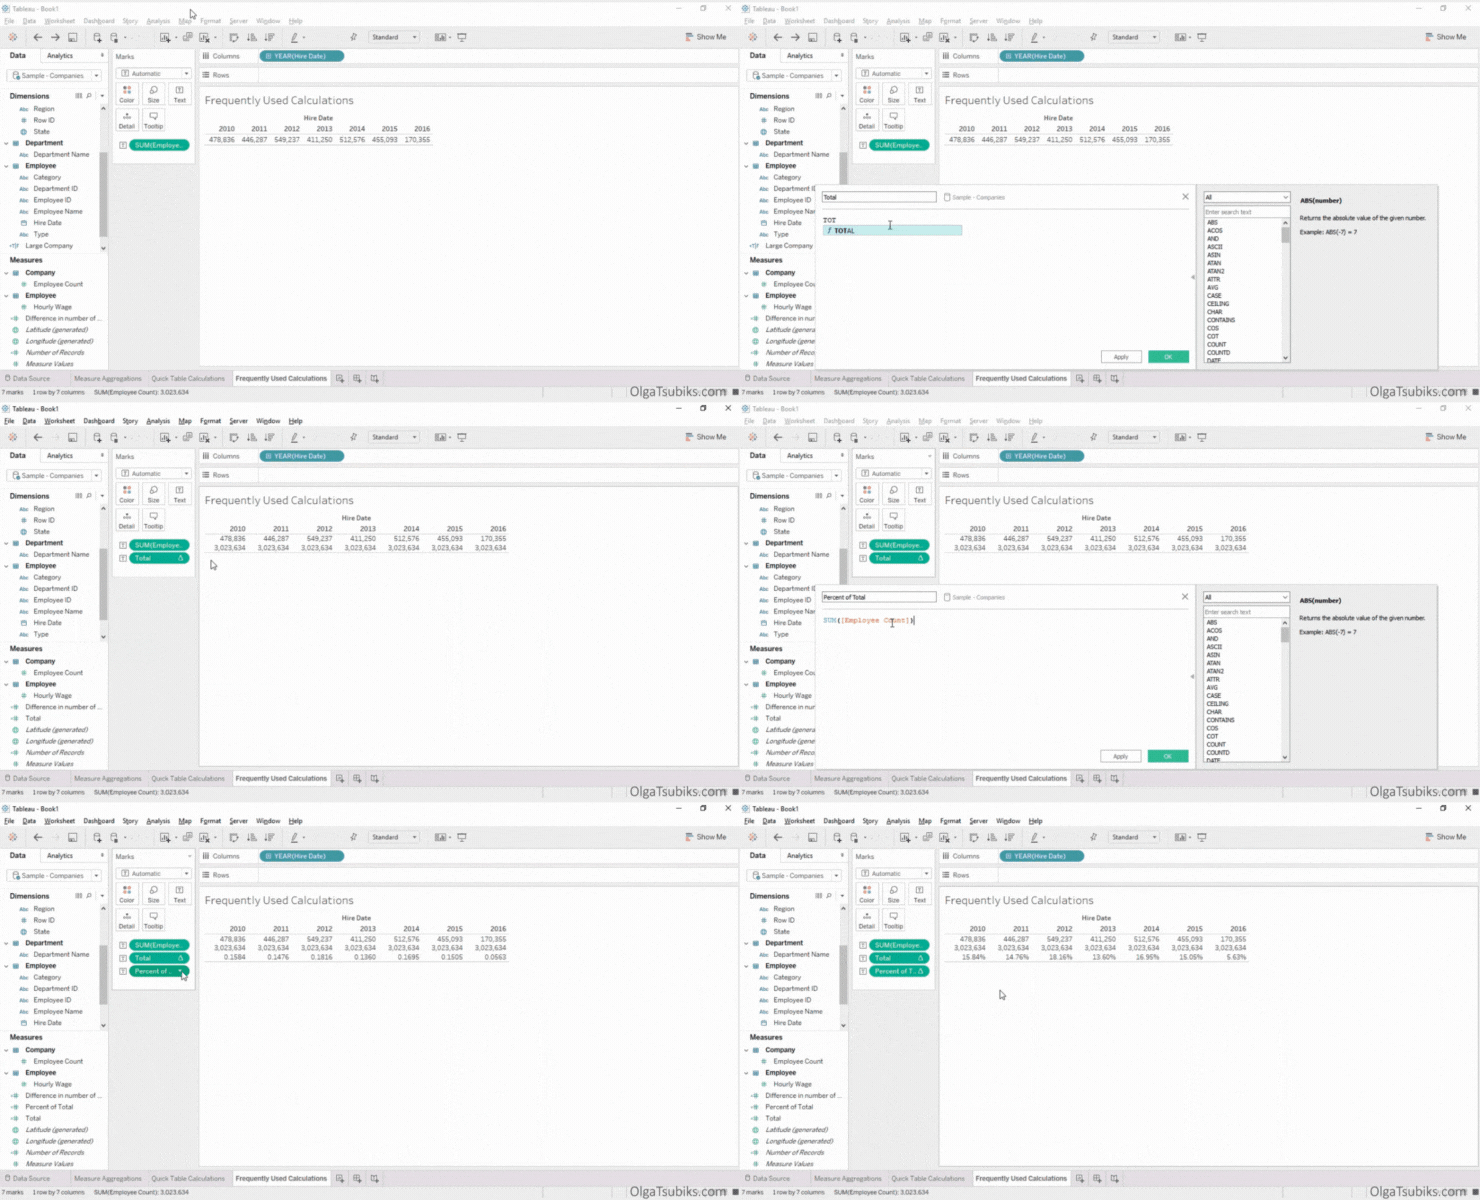
Solution:
Create a new calculation called Total. Type TOTAL() and drag and drop the SUM([Employee Count]) measure into the brackets. The resulting calculation should look like this: TOTAL(SUM([Employee Count])). Place the Total calculation on the Text Marks Card. You will see a Total row. Now let’s use the Total calculation to find the percentage of the total.
Create a new calculation. Name it Percent of Total. Drag and drop the SUM([Employee Count]) measure into Calculation Editor, and divide it by the Total calculated field. Place the Percent of Total calculation on the Text Marks Card. Change the format to Percentage.
We can see, for example, that 18.16% of all employees were hired in 2012.
It is also possible to create this calculation in one step by using this calculation: SUM([Employee Count] / TOTAL(SUM([Employee Count])).
You can find this calculation in Quick Table Calculations > Percent of Total. Now you know exactly how it is created!
Download/view this practice workbook
4. RANK(expression, [‘asc’|’desc’])
This returns the standard competition rank for the current row in the partition. Identical values are assigned an identical rank. Use the optional ‘asc’ | ‘desc’ argument to specify ascending or descending order. The default is descending.
For example, in our table of the number of employees hired each year, let’s rank years by the number of employees hired.
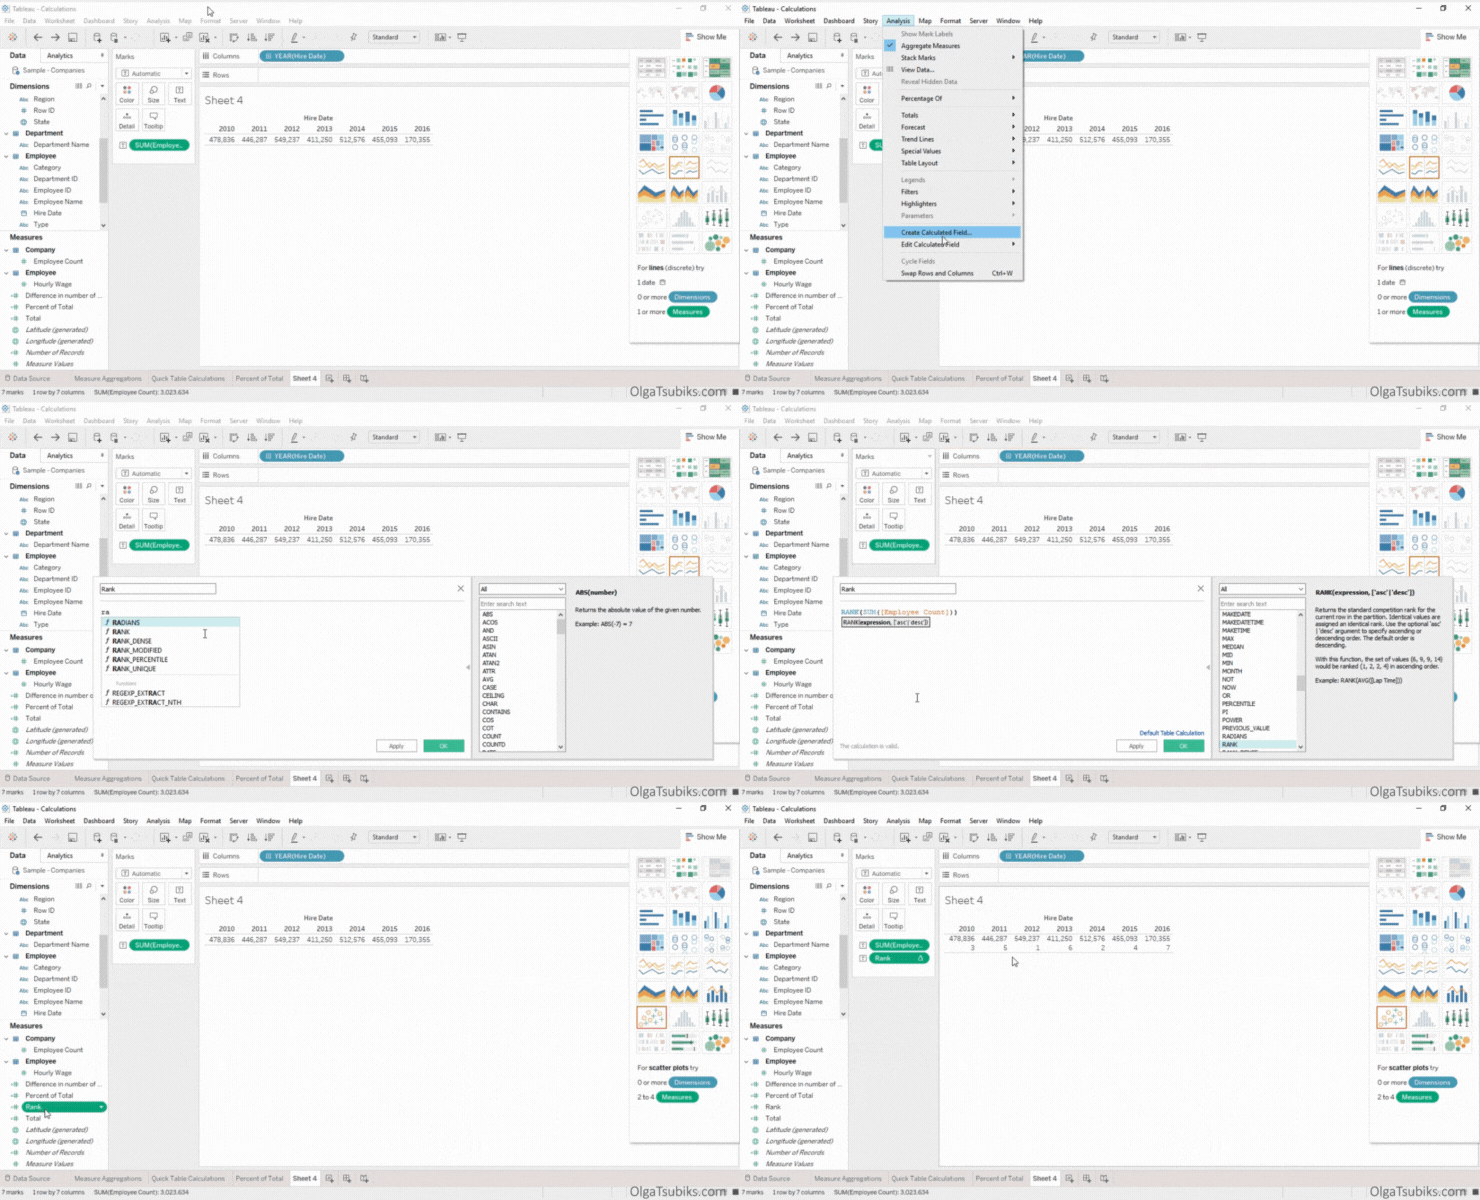
Solution: Create a new calculation for rank by typing RANK() and dragging and dropping the SUM([Employee Count]) into the brackets. The resulting calculation should look like this: RANK(SUM([Employee Count])). Tableau will rank years in descending order. You can find this calculation in Quick Table Calculations > Rank.
In this example, 2012 ranks first by number of employees hired in that year.
5. WINDOW_AVG(expression, [start, end])
This returns the average of the expression within the window. The window is defined by means of offsets from the current row.
For example, in our table of number of employees hired each year, let’s calculate the moving average.

Solution:
Create a new calculation called Moving Average.
Use the following calculation: WINDOW_AVG(SUM([Employee Count]), -2, 0). This calculation takes the SUM([Employee Count]) from two rows before the current row and computes an average. You can find this calculation in Quick Table Calculations > Moving Average.
Moving average in 2015 is 259640.
Download/view this practice workbook
6. ABS()
This returns the absolute value of the given number.
For example, let’s return to the difference in number of employees calculation that we created and edited earlier. ABS([Difference in number of employees]) would give us positive numbers only.
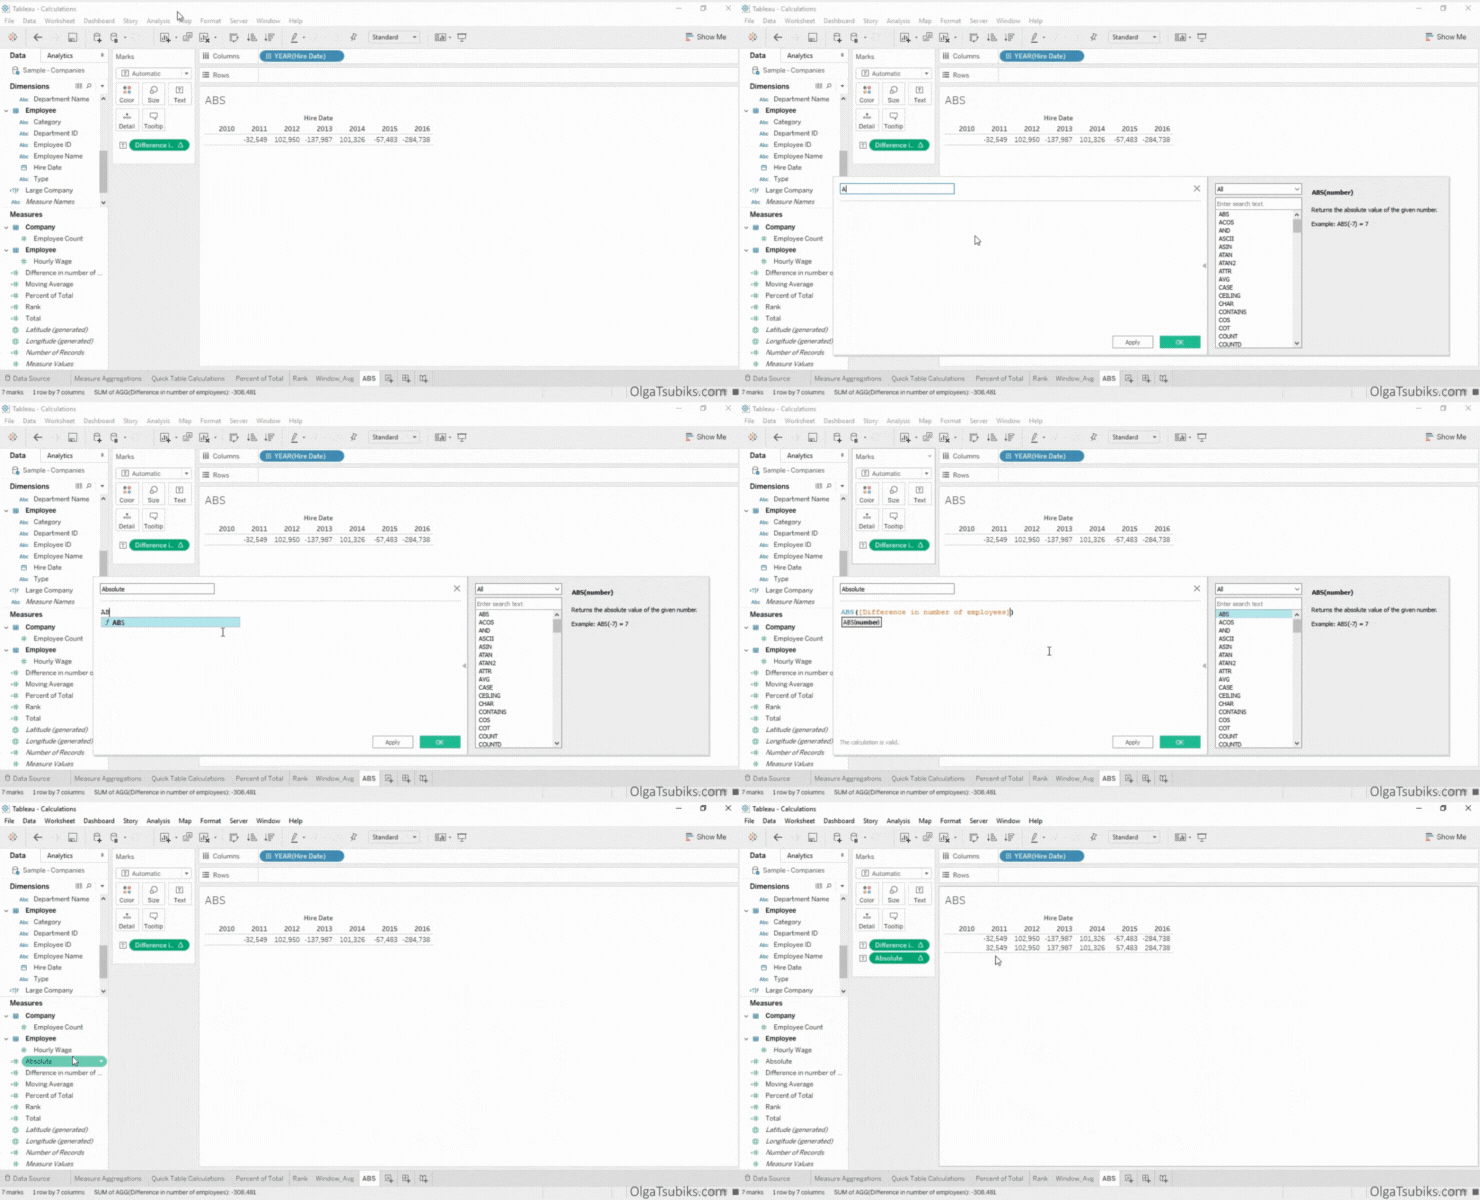
Solution:
Create a new calculation called Absolute.
Add the following calculation: ABS([Difference in number of employees]). This calculation is typically used as a part of other calculations, such as YTD Growth.
7. INDEX()
This returns the index of the current row in the partition, without any sorting with regard to value. The first row index starts at 1. It is a very handy function, that is typically used in conjunction with other functions such as LOOKUP().

Solution: Create a new calculation called Index. Add the following function INDEX().
8. FIRST()
This returns the number of rows from the current row to the first row in the partition. For example, let’s find the difference in the number of employees between the first year and all the consecutive years.
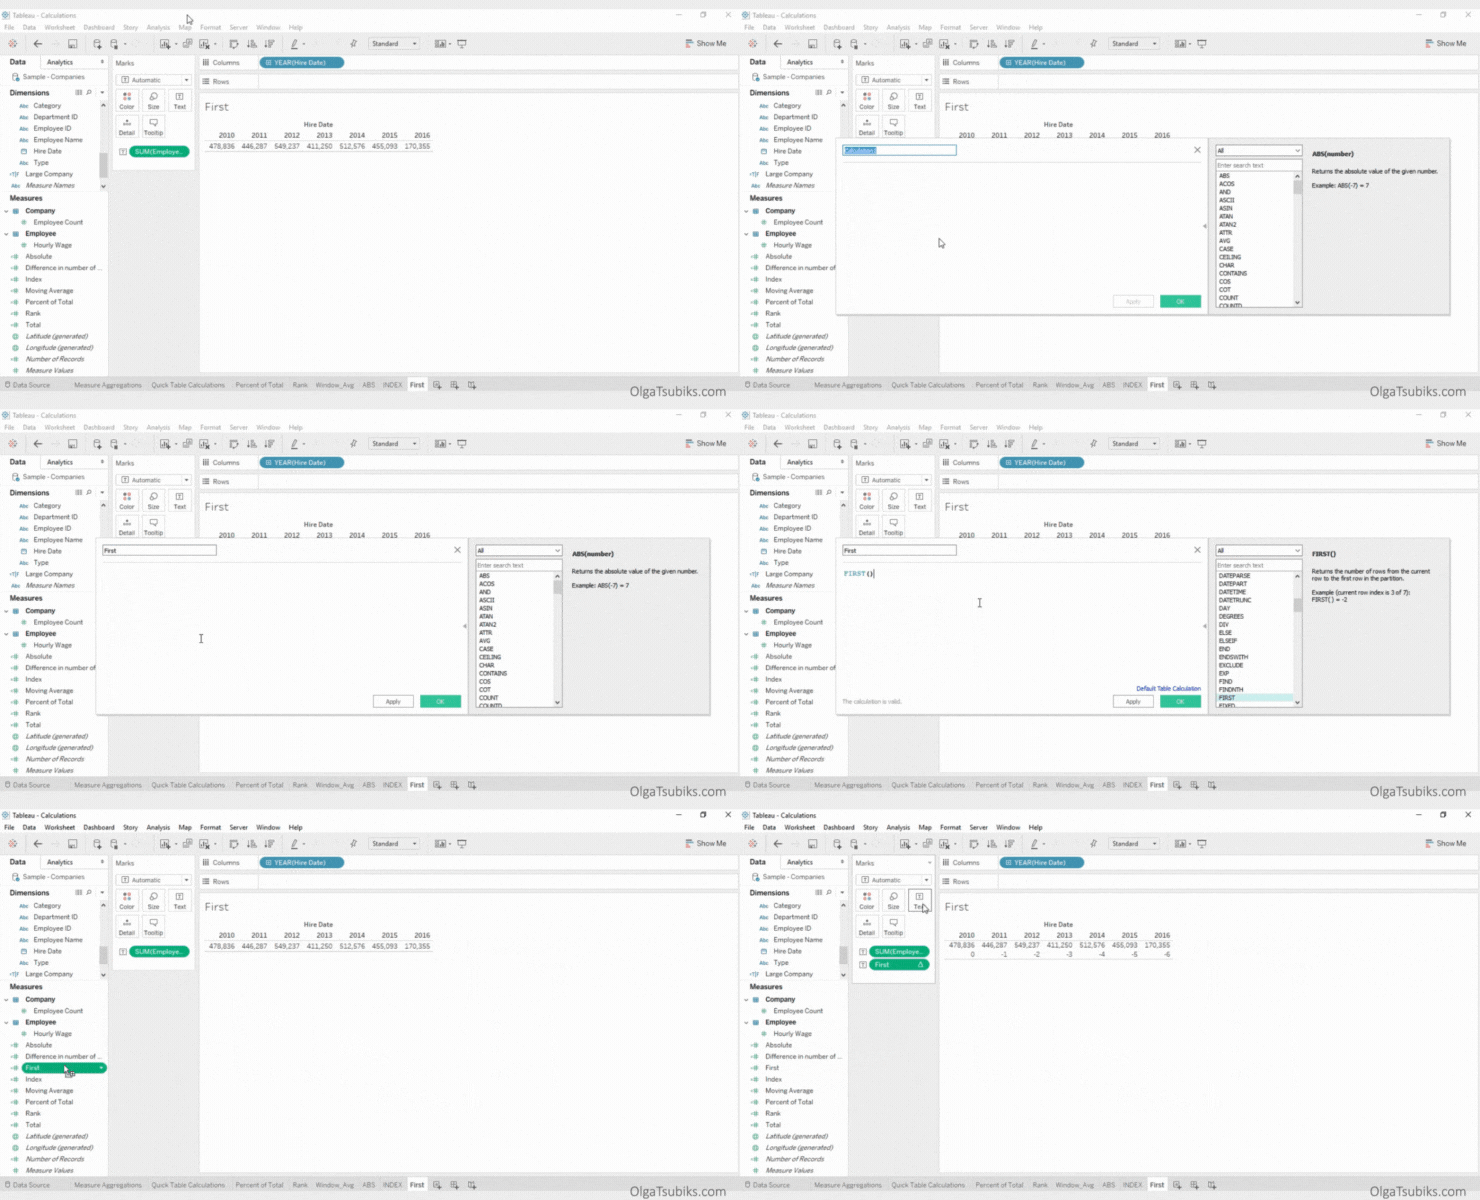
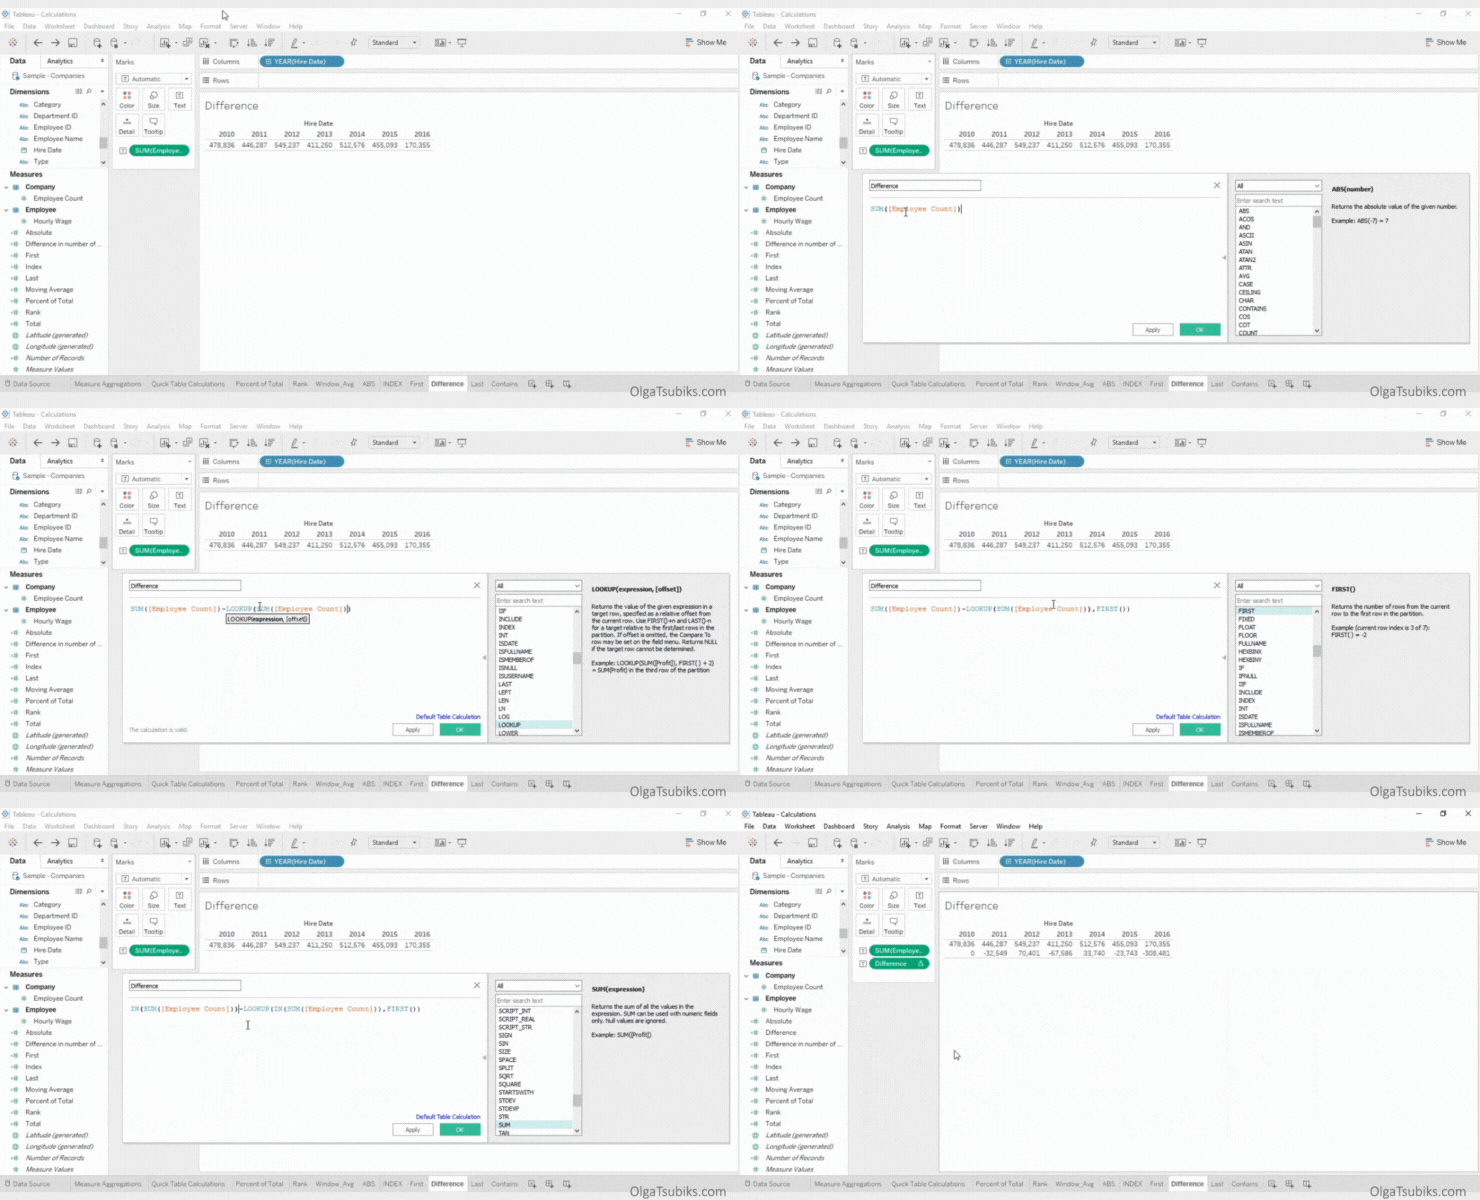
Create a new calculation. Name it Difference. Add the following calculation: ZN(SUM([Employee Count]))-LOOKUP(ZN(SUM([Employee Count])), FIRST()). The first part of the calculation finds the value for the current row, and the second finds the value for the first row.
In this example, the difference in the number of employees between 2015 and 2010 is -23743.
9. LAST()
This returns the number of rows from the current row to the last row in the partition. For example, let’s find the difference between the last year in the table and the first.
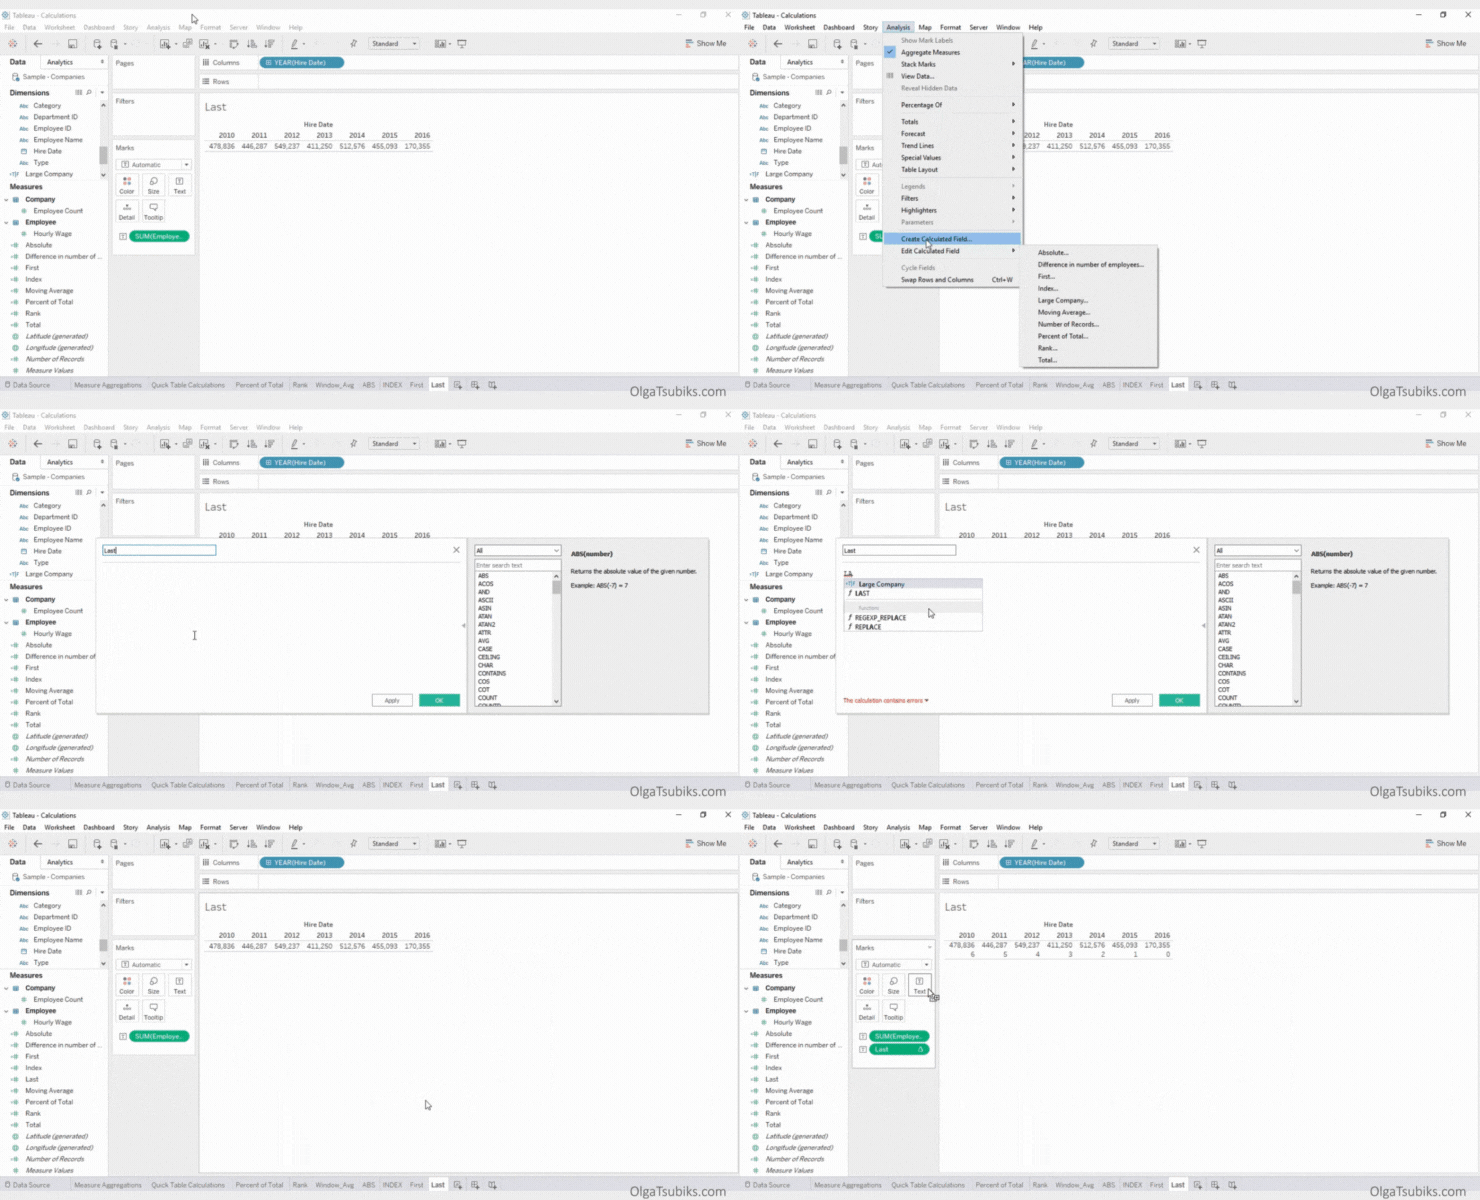
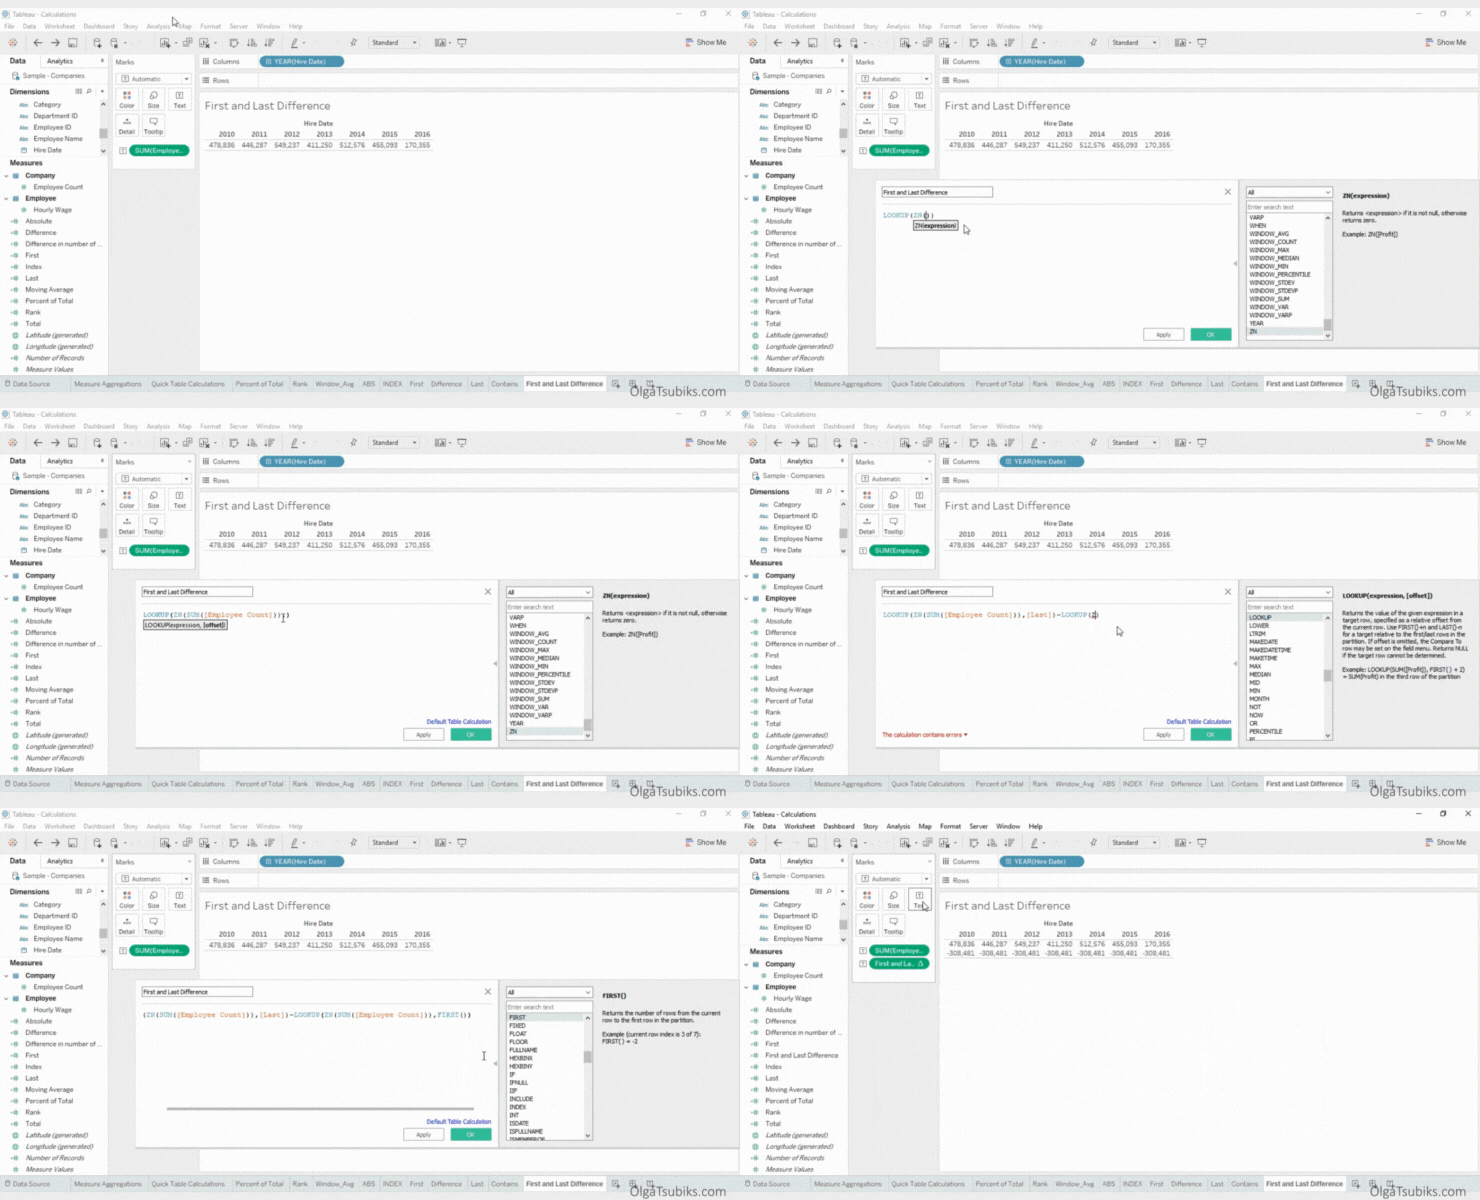
Create a new calculation called First and Last Difference. Add the following calculation: LOOKUP(ZN(SUM([Employee Count])), LAST())-LOOKUP(ZN(SUM([Employee Count])), FIRST()). The first part of the calculation finds the value for the last row, and the second part finds the value for the first row.
In the example above, the last and the first year is -308481.
10. CONTAINS(expression, expression to search for)
This returns true if the given string contains the specified substring.
For example, let’s find out how many people with the surname Brown were hired in each year.
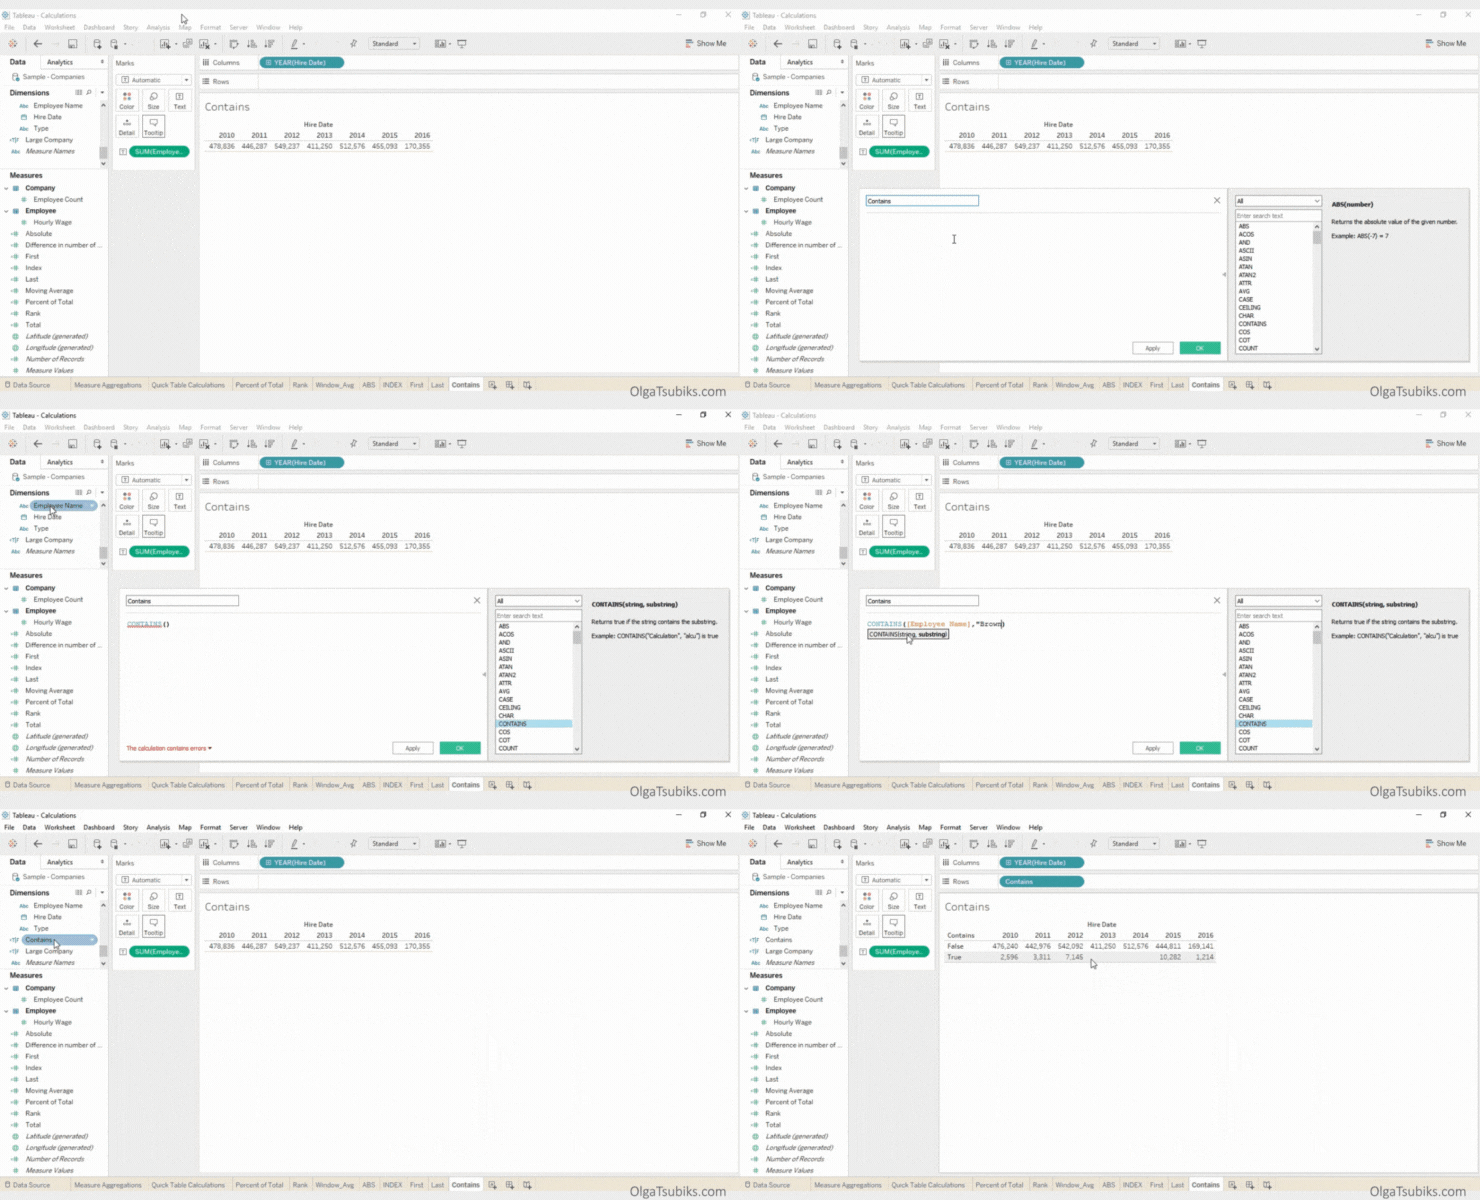
Create a new calculation. Name it Count. Add the following calculation: COUNTD(CONTAINS([NAME],”Brown”)).
For example, 3311 people with name that contains the word Brown where hired in 2011.
